

Corruption
Follow the Money
Global corruption hit a record low score of 42 in 2025, but the index still overlooks Western financial secrecy
Corruption is the abuse of entrusted power for private gain. It ranges from grand corruption at the highest levels of government to the small bribes ordinary people pay for basic services. Transparency International’s Corruption Perceptions Index is the world’s most widely cited measure of it. The 2025 edition, published February 2026, shows a genuinely troubling picture, alongside a blind spot worth examining closely.
The 2025 Corruption Perceptions Index: A New Low
The CPI ranks 182 countries and territories on a scale of 0, highly corrupt, to 100, very clean, drawing on 13 independent data sources. In 2025, the global average fell to 42, a new record low, and the first decline in more than a decade.
The scale of the problem is stark. 122 of 182 countries, more than two-thirds, score below 50. Only five countries now score above 80, down from twelve a decade ago: Denmark (89), Finland (88), Singapore (84), New Zealand (81), and Norway (81). Denmark has topped the index for eight consecutive years.
At the bottom, South Sudan and Somalia share last place at 9, followed by Venezuela at 10, and Yemen, Libya, and Eritrea all at 13. Western Europe supplies nine of the top ten countries overall, yet the region’s average is falling faster than any other, a genuine warning sign inside its own success story.
Established Democracies Are Sliding
The most striking 2025 finding is not in the bottom tier, but among wealthy democracies. The United States fell to its lowest-ever CPI ranking, 29th of 182 countries, with a score of 64, down from previous years. The UK scored 70, France 66, and Sweden fell to 80 from 82 the year before.
Transparency International ties this directly to democratic backsliding: the use of public office to target NGOs and journalists, transactional politics, and pressure on judicial independence. In almost two-thirds of countries whose scores have significantly declined since 2012, researchers found a parallel pattern of shrinking civic space, restrictions on free expression, association, and assembly.
When Corruption Anger Becomes a Political Force
Corruption is no longer just a ranking. In 2025, it became a direct trigger for regime change. Transparency International explicitly links the Gen Z-led protests that toppled governments in both Nepal and Madagascar that year to public anger over corruption and unaccountable leadership.
RYB covers Nepal’s uprising in detail on its Nepal Global Development page, where September 2025 protests forced out a sitting prime minister and installed Nepal’s first female head of government within months. Corruption anger, not a single issue alone, ran underneath that entire political shift.
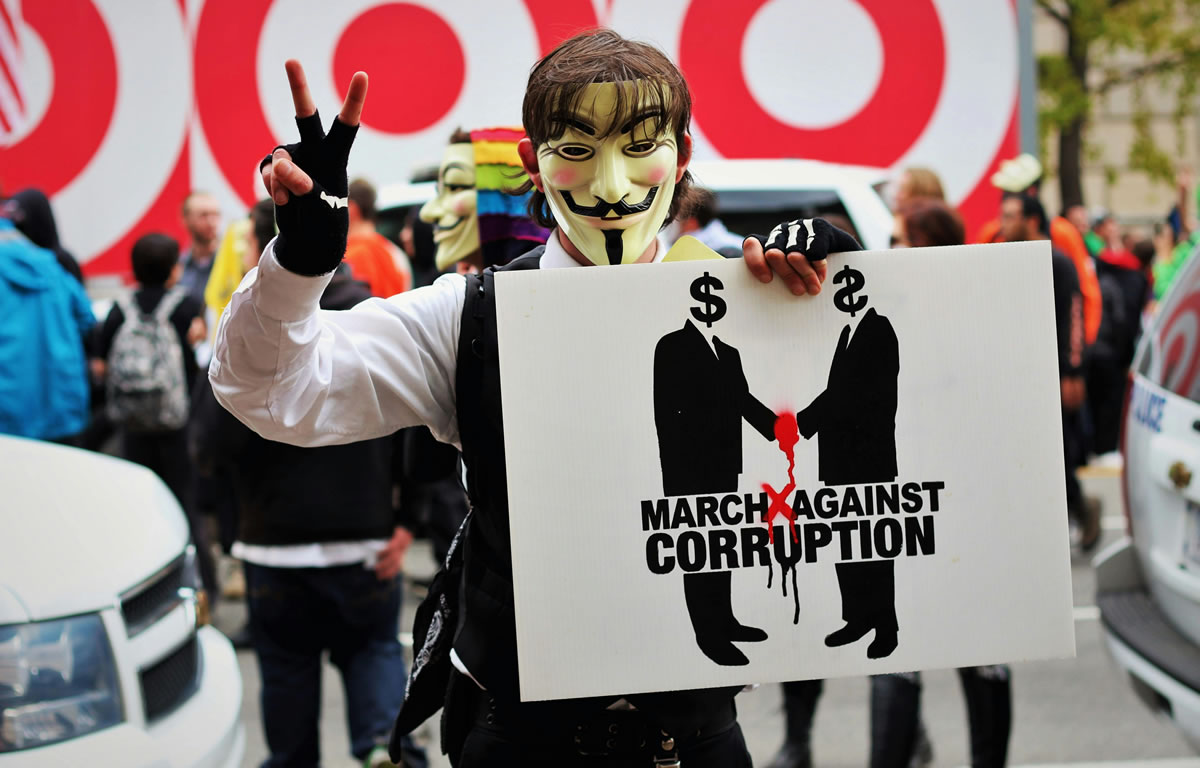
Photo: Vincent M.A. Janssen
The Human and Journalistic Cost
Corruption is not a victimless statistic. Unofficial fees and bribery function as a regressive tax, taking a larger share of income from the poorest households, and can push families out of healthcare or education entirely when access depends on payment rather than entitlement.
Journalists investigating corruption pay a direct price. Since 2012, 150 journalists have been killed while covering corruption-related stories in non-conflict zones, and more than 90% of those killings occurred in countries scoring below 50. In 2025 alone, this included Turki al-Jasser, executed by Saudi authorities after seven years in detention, and Gastón Medina, shot outside his home in Peru.
Corruption also increasingly intersects with climate vulnerability. Transparency International’s research finds stolen or mismanaged climate adaptation funds are a recurring pattern, leaving flood defences unbuilt and infrastructure investments incomplete in communities that can least afford the consequences.
The Arms Trade: Corruption’s Most Concentrated Sector
If corruption were distributed evenly across the global economy, the arms trade would barely register. It accounts for roughly 0.5% of global trade by value. Yet one widely cited researcher estimate, tracked by Campaign Against Arms Trade, puts the arms trade’s share of all corruption cases in international trade at around 40%, a concentration few other sectors come close to matching.
Transparency International’s Defence & Security programme has spent years documenting why. Its Government Defence Integrity Index found 62% of countries face a high or critical risk of corruption in their defence and security sectors, with an average G20 score of just 49 out of 100, roughly the same as the CPI’s own troubled global average.
The trade flows compound the risk. Between 2016 and 2020, 86% of global arms exports originated from countries rated moderate to very high risk for defence corruption, while 49% of global arms imports went to countries facing high or critical corruption risk themselves, a pattern of high-risk sellers meeting high-risk buyers with little independent oversight on either side.
Corporate behaviour tells a similar story. SIPRI’s arms industry data shows the world’s four largest arms producers, General Dynamics, NORINCO, AVIC, and Rostec, collectively responsible for $876 billion in trade, all scored poorly on Transparency International’s Defence Companies Index, which measures anti-corruption and transparency commitments. Just 12% of the 134 companies assessed in the most recent full index received a top rating.
Why does defence corruption persist so stubbornly? Transparency International points to three structural reasons: enormous sums of money change hands, contracts are tightly bound up with politics, and the sector operates under a level of secrecy, often justified as national security, that most industries could never claim. Arms deals frequently proceed without the parliamentary scrutiny, competitive bidding, or public disclosure that governs ordinary government procurement.
This has a long, well-documented history. The UK’s BAE Systems Al Yamamah deal with Saudi Arabia, signed in 1985 and worth tens of billions of pounds, remains one of Britain’s largest-ever arms contracts, and one of its most persistently corruption-linked. It illustrates the same pattern raised earlier in this page: a country ranking comfortably on the CPI while a landmark deal from its own defence industry has drawn corruption allegations for four decades.
The scale of what is at stake keeps growing. Global military expenditure reached $2.887 trillion in 2025, SIPRI’s eleventh consecutive year of increases, driven by rearmament in Europe and Asia following Russia’s invasion of Ukraine and rising Middle East tensions. For comparison, that figure is more than sixteen times total global ODA in 2025, covered on RYB’s ODA page, a reminder of how much larger and less scrutinised military budgets are than the aid budgets currently facing historic cuts.
Transparency International’s own recommendation is direct: bring arms transfers under stronger multilateral oversight, including through the Arms Trade Treaty framework, and treat corruption risk as a core part of defence and foreign policy decisions, not an afterthought to them.
Flipping the Corruption Myth
RYB has long featured a deliberately critical perspective on the CPI itself, and current data now makes that critique easier to support with hard numbers, not just argument. Anthropologist Jason Hickel has argued the index tells a “beguiling story” that ignores the financial and political corruption embedded in wealthy nations that score well.
His central claim: British secrecy jurisdictions facilitate the movement of trillions of dollars out of Global South countries, yet the UK itself consistently ranks among the “least corrupt” nations on the CPI. RYB’s own coverage of the Corporate Tax Haven Index now shows precisely this gap in numbers: the UK and its network of Overseas Territories, including the British Virgin Islands, Cayman Islands, and Bermuda, top every ranking of jurisdictions enabling global corporate tax abuse, responsible for an estimated $84 billion in losses to other countries annually. Yet the UK’s CPI score in 2025, 70, still places it comfortably in the world’s top quartile.
The United States offers a related case from a different angle. Its CPI score fell to 64 in 2025, its worst-ever ranking. RYB’s Financial Secrecy page shows the US simultaneously ranks first in the world on the Financial Secrecy Index, the single largest enabler of global financial secrecy, a distinct but closely related failure the CPI’s methodology, focused on public-sector bribery and abuse of office, was never designed to capture.
This is not an argument that the CPI is meaningless. Its findings on civic space, journalist safety, and institutional backsliding are well-documented and genuinely important. It is a reminder that “corruption,” as commonly measured, describes one specific type of theft, bribery and abuse of public office, while largely missing a second, arguably larger one: legal, structural extraction of wealth from developing countries through secrecy jurisdictions the CPI’s own top-ranked countries maintain.
How This Connects to Global Development and the SDGs
Corruption sits at the center of SDG 16, peace, justice, and strong institutions, which explicitly targets reduced bribery and corruption alongside effective, accountable institutions. The CPI’s decline shows this target moving in the wrong direction globally, for the first time in over a decade.
The connection to SDG 1, ending poverty, and SDG 10, reducing inequality, runs through the regressive-tax effect described above: bribery costs the poorest households a larger share of their income, and unequal access to justice compounds existing inequality rather than correcting it.
Read alongside RYB’s Tax Havens and Financial Secrecy coverage, corruption forms one half of a larger picture. Public-sector bribery drains resources visibly, country by country. Financial secrecy in wealthy jurisdictions drains resources less visibly, but often on a larger scale, exactly the connection Hickel’s critique and the CPI’s own blind spot both point toward.
Looking Forward
Transparency International’s own recommendations for 2026 center on protecting independent judiciaries, making political finance transparent, and clamping down on cross-border flows of dirty money, an explicit acknowledgment that public-sector corruption and offshore financial secrecy are connected problems, not separate ones.
Whether wealthy democracies reverse their 2025 declines, or whether backsliding continues into 2026 and beyond, will be a key test of the CPI’s own warning about eroding checks and balances. RYB will track both the CPI’s country-level findings and how they compare against the Financial Secrecy Index and Corporate Tax Haven Index rankings covered elsewhere on this site.
This page will be updated as the next CPI edition, and any related developments across RYB’s country pages, emerge.
Further Perspectives
- Jason Hickel, “Flipping the corruption myth” — aljazeera.com
- Citations Needed, Episode 73: “Western Media’s Narrow, Colonial Definition of ‘Corruption'” — soundcloud.com
Sources and References
- Transparency International, Corruption Perceptions Index 2025 — transparency.org/en/cpi/2025
- Transparency International, “CPI 2025: Findings and insights” — transparency.org
- Transparency International, Corruption Perceptions Index 2025, full report (PDF) — files.transparencycdn.org
- Forbes, “U.S. Drops To Its Lowest Ranking In Global Corruption Perceptions Index” — forbes.com
- Wikipedia, “Corruption Perceptions Index” — en.wikipedia.org
- Transparency International UK, “62% of countries at high risk of defence and security corruption, index reveals” — transparency.org.uk
- Transparency International Defence & Security, “Latest SIPRI report raises serious concerns over corruption in arms sector” — ti-defence.org
- Transparency International Defence & Security, Defence Companies Index on Anti-Corruption and Corporate Transparency — ti-defence.org
- Campaign Against Arms Trade, “Corruption” — caat.org.uk
SIPRI, “Trends in World Military Expenditure, 2025” — sipri.org - SIPRI, “Global military spending rise continues as European and Asian expenditures surge” — sipri.org
- RYB, Tax Havens and the Offshore World — redyellowblue.org/finance/tax-havens-offshore-world/
- RYB, Financial Secrecy — redyellowblue.org/finance/financial-secrecy/
- RYB, Official Development Assistance (ODA) — redyellowblue.org/finance/oda/