

Denmark Sustainable Development Goals (SDGs)
3 / 169
SDG Index Rank, 2026
85.68
SDG Index Score (out of 100)
157 / 169
Spillover Rank, 2026
58.77
Spillover Score (out of 100)
Source: Sustainable Development Report 2026, Sachs, J.D., Lafortune, G., Fuller, G., Iablonovski, G. Paris: SDSN, Dublin: Dublin University Press.
Most people have never heard of the Sustainable Development Goals in any real detail. Surveys across the US, UK, France, and Germany find only 8-12% of people can actually say what the SDGs are. RYB exists to close that gap, looking at the same reports and reviews the UN and researchers use, and explaining them as we go.
Denmark ranks 3rd out of 169 countries on the 2026 SDG Index — one of the very best domestic records RYB has reviewed. Its spillover rank tells the opposite story: 157th out of 169, the worst RYB has recorded in this series, worse even than Germany’s 149th. No country RYB has covered shows a wider gap between how it treats its own people and what its economy asks of everyone else.
Denmark — Sustainable Development Report 2026
DK
Denmark’s SDG Story
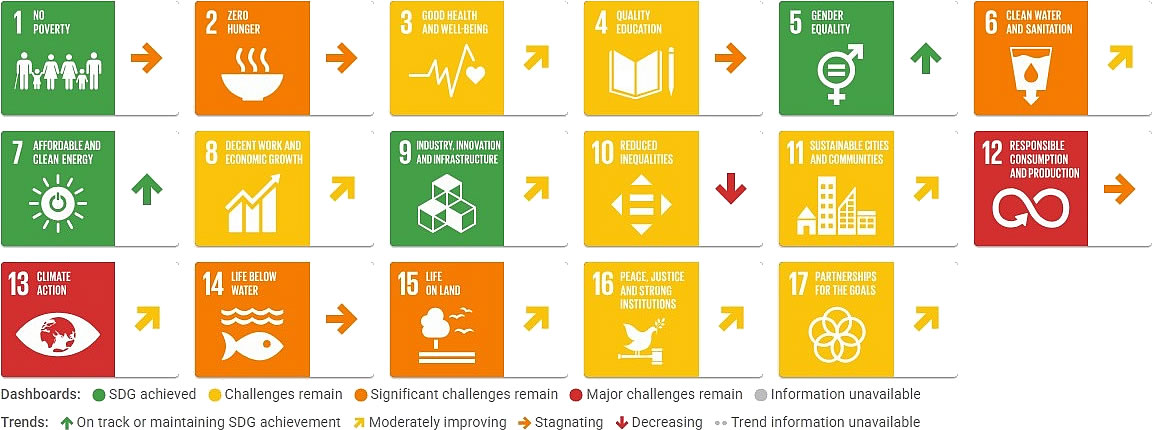
Denmark’s 85.68 score is built on a run of genuinely exceptional numbers: extreme poverty essentially eliminated, universal access to water, sanitation, and clean cooking fuel, and a Corruption Perceptions Index of 89, among the highest RYB has recorded. Its Statistical Performance Index of 92.05 means the data behind this page is about as reliable as any RYB has worked with.
Gender equality: the strongest figures RYB has recorded
SDG 5 (Gender Equality) is rated green. Women hold 44.1% of parliamentary seats, and the gender wage gap is just 3.3% of male median wages — the narrowest gap RYB has found in this series, far ahead of Germany’s 13.5% and a fraction of Japan’s 20.65%.
Innovation and energy: two more green goals
SDG 9 (Industry, Innovation and Infrastructure) is rated green, with R&D spending at 3.05% of GDP and patent applications among the highest per capita RYB has recorded. SDG 7 (Clean Energy) is also green: renewable energy makes up 38.8% of final energy consumption, more than double Japan’s 9.3%.
A climate paradox: the highest carbon price, and still-high emissions
SDG 13 (Climate Action) is rated red, which sits oddly next to Denmark’s climate policy reputation. CO2 emissions from fossil fuel combustion run to 4.76 tonnes per capita, rated red. But Denmark’s Net Effective Carbon Rate — what a country’s economy actually pays per tonne of CO2 once every tax and subsidy is netted out — is €108.14, the highest RYB has recorded by a wide margin and rated green. Denmark prices carbon more aggressively than any country RYB has reviewed, and its per-capita emissions are still comparatively high. Strong policy hasn’t yet translated into a low number.
Responsible consumption: Denmark’s clearest red flag
SDG 12 (Responsible Consumption and Production) is rated red, anchored by the highest plastic waste export figure RYB has recorded anywhere: 13.56 kg per capita, well above Germany’s 8.98 kg, the previous highest. Production-based nitrogen emissions and nitrogen embodied in imports are both rated red as well.
Voluntary National Reviews and National Implementation
Two VNRs, and a gap now longer than the interval between them
Denmark presented its first Voluntary National Review in 2017 and its second in 2021, but has not presented a third as of 2026 — a five-year gap that’s now longer than the four years between its first two reviews. Denmark’s own 2021 VNR named its key challenges explicitly: “responsible consumption and production” and “climate action,” alongside further attention needed on life in the ocean and on land. Five years later, the SDR 2026 data confirms exactly that — SDG 12 and 13 remain the two goals rated red. Denmark identified its own weak points accurately; the numbers simply haven’t moved much since.
Gladsaxe’s first-ever Danish VLR, inside a wider Nordic wave
Gladsaxe Municipality published the first-ever Voluntary Local Review from a Danish municipality in 2021, built around a Green Transition Strategy, circular procurement practices, and a Child Friendly Cities initiative. It landed as part of a broader regional moment: 14 VLRs came out of Nordic municipalities and counties that same year. Other Danish municipalities have pursued the SDGs without going through a formal VLR — Sønderborg adopted a dedicated 2021-2024 Sustainability Policy, Vejle built its resilience strategy explicitly around the goals, and Copenhagen set binding sustainability requirements when co-hosting UEFA Euro 2020, using a mega-event as leverage for its own SDG commitments. Regions and municipalities have participated formally in both of Denmark’s national VNRs through Local Government Denmark (KL) and the country’s 2030 Panel.

What the Sustainable Development Report Shows: International Spillovers
The Sustainable Development Report scores every country two ways. The overall score measures how well a country is doing for its own people. The spillover score measures how much harm a country’s economy causes everyone else.
Denmark’s spillover rank of 157th out of 169 is the worst RYB has recorded in this series — worse than Germany’s 149th, New Zealand’s 145th, and every other country reviewed so far. It’s a genuinely striking pairing: the 3rd-best domestic score in this series next to the single worst international one.
The highest plastic waste export figure recorded, again
The 13.56 kg per capita of plastic waste Denmark exports is the same figure driving its SDG 12 rating above — and it’s the largest single number behind the poor spillover score too.
Imported deforestation: a footprint tied to what Denmark eats
Denmark’s imported deforestation figure — land cleared abroad to produce what the country imports — comes to 45.74 square meters per capita, rated red and among the highest RYB has recorded. Denmark is one of the world’s largest per-capita producers of pork and dairy, industries that depend heavily on imported soy for animal feed, much of it grown on recently cleared land in South America. The environmental cost of that supply chain shows up here, not in Denmark’s own land-use statistics.
Where Denmark’s numbers are genuinely strong
Not every spillover indicator points the same way. Denmark’s international concessional public finance — development aid — comes to 0.72% of gross national income, rated green and one of the few RYB has seen that actually clears the UN’s 0.7% target. Its Financial Secrecy Score (39) and Corporate Tax Haven Score (49) are both real, measured figures — unlike many countries in this series where one or both are imputed — and both rate green.
Why These Numbers Matter
A high overall SDG score measures how a country treats its own people. It says nothing about what that country’s economy asks of everyone else — the waste it exports, the land cleared abroad to grow what it imports, the emissions embedded in its supply chains. Denmark is the sharpest illustration RYB has found of exactly that gap: excellent by nearly every domestic measure, and the most harmful to the rest of the world by this one.
RYB’s Place in This Picture
Denmark’s spillover rank of 157th is the worst RYB has recorded, a reminder that a small, wealthy, well-governed country can still carry an outsized international footprint. See the full picture, ranked side by side, on RYB’s Global Responsibility page.
UNDP
Human Development Report — Denmark
The Human Development Index measures something narrower and older than the SDGs: life expectancy, education, and income, combined into a single score, with no 2030 deadline attached. It is a different lens on the same country, worth reading alongside the SDG data above rather than instead of it.
Denmark’s HDI is 0.962 (2023 data), ranking 4th globally — the highest RYB has recorded in this series, just ahead of Germany’s 5th-place 0.959. Life expectancy stands at 82.2 years. Regionally, the range is narrow by global standards but still real: the Capital Region of Denmark leads at 0.971, while Region Zealand trails at 0.929 — both figures that would rank among the world’s best on their own, illustrating just how high Denmark’s floor sits.
Denmark’s Human Development Index data →
What is the difference between the HDI and the SDGs? →