

Japan Sustainable Development Goals (SDGs)
20 / 169
SDG Index Rank, 2026
81.02
SDG Index Score (out of 100)
128 / 169
Spillover Rank, 2026
73.53
Spillover Score (out of 100)
Source: Sustainable Development Report 2026, Sachs, J.D., Lafortune, G., Fuller, G., Iablonovski, G. Paris: SDSN, Dublin: Dublin University Press.
Most people have never heard of the Sustainable Development Goals in any real detail. Surveys across the US, UK, France, and Germany find only 8-12% of people can actually say what the SDGs are. RYB exists to close that gap, looking at the same reports and reviews the UN and researchers use, and explaining them as we go.
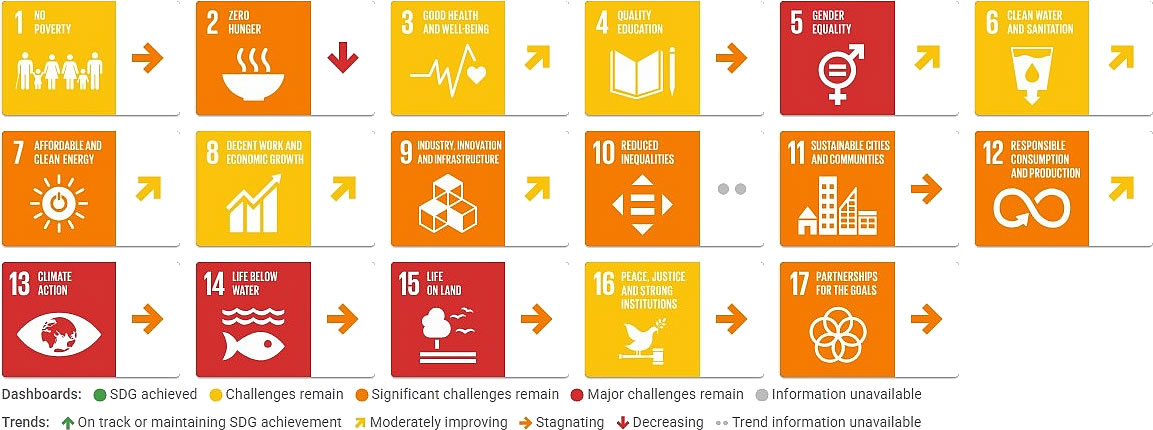
Japan ranks 20th out of 169 countries on the 2026 SDG Index — respectable, but well behind the other high-income countries RYB has covered, including Germany (5th) and Switzerland (22nd, just below Japan). The reason isn’t infrastructure, health, or poverty — Japan posts the highest life expectancy (85.0 years) RYB has recorded for any country. It’s gender. SDG 5 is Japan’s only goal rated red, and it’s a stark one: just 15.5% of parliamentary seats are held by women, and the gender wage gap runs to 20.65%, both among the weakest figures in this series. No other goal on Japan’s dashboard is rated green — the first time RYB has found a country with zero green ratings and a top-20 overall score at the same time.
Japan — Sustainable Development Report 2026
JP
Japan’s SDG Story
Japan’s 81.02 overall score rests on genuine strengths: universal electricity and clean cooking access, a maternal mortality ratio of 3.1 per 100,000 births, near-zero homicide (0.23 per 100,000), and the world’s highest recorded life expectancy in this series. Statistical capacity is also excellent — a Statistical Performance Index of 90.99, on par with Germany’s 90.06.
No green goals — a first for this series
Every one of Japan’s 17 goals rates yellow, orange, or red on the dashboard; none rates green. That’s a genuinely unusual profile for a country this far up the overall rankings — most top-20 countries RYB has covered have at least one or two green-rated goals to point to. Japan’s strengths are real, but they consistently fall just short of “on track” by the report’s own thresholds.
SDG 5: the one red goal, and a familiar story
Gender equality is Japan’s weakest point by a wide margin. Beyond the 15.5% parliamentary representation and 20.65% wage gap, the female-to-male labor force participation ratio (78.2%) and female share of STEM graduates (18.1%, also rated red) round out a pattern that’s well documented outside the SDR too — Japan ranked 118th out of 148 countries in the World Economic Forum’s 2025 Global Gender Gap Report, the lowest of any G7 country. See the full picture on Japan’s Gender Gap page.
Climate, oceans, and land: three reds together
SDG 13 (Climate Action), SDG 14 (Life Below Water), and SDG 15 (Life on Land) are all rated red — a harder combination to find than any single red goal. Japan’s renewable energy share sits at just 9.3% of final energy consumption (red), and its Net Effective Carbon Rate — a measure of how much a country actually prices carbon once every tax, subsidy, and permit is netted out — is €5.75 per tonne of CO2 equivalent, also red and declining. On oceans, 60.9% of Japan’s catch now comes from overexploited or collapsed fish stocks, a striking figure for a country whose culture and economy are so closely tied to fishing. On land, both terrestrial and freshwater biodiversity protection are rated red, and the Red List Index of species survival is declining.
Three VNRs, and a fast-growing local mandate
Japan has presented three Voluntary National Reviews: 2017 (its first, built around the “PPAP” Public-Private Action for Partnership framework), 2021 (framed around COVID-19 recovery and “building back better”), and 2025 (its third, presented at the HLPF on July 22, 2025, describing four years of progress backed by academia, youth, civil society, and the private sector). Between the first and second VNRs, Japan tracked a striking localization shift: the share of local governments actively working on the SDGs rose from just 1% in 2017 to 39.7% by 2020, with an official government target of 60% by the end of FY2024.
Where the world’s first VLRs were written
This is Japan’s strongest implementation story, and one no other country RYB has covered can claim: the Voluntary Local Review itself was invented here. In 2018, Kitakyushu, Toyama, and Shimokawa — Japan’s first three “SDGs Future Cities” — published their VLRs alongside New York City, the four founding VLRs of a format that has since spread to hundreds of cities worldwide, including Germany’s Mannheim and Bonn. As of March 2026, nine Japanese local governments have published VLRs, including Yokohama’s second review and reports from Tokyo, Hamamatsu, Toyota, Sado, and Gamagori. Where most countries RYB covers are still catching up to a format that started elsewhere, Japan’s cities wrote the first page of that format themselves.

What the SDR Shows: International Spillovers
The Sustainable Development Report scores every country two ways. The overall score measures how well a country is doing for its own people. The spillover score measures how much harm a country’s economy causes everyone else.
Japan’s spillover rank — 128th out of 169 — is a meaningful drop from its 20th-place overall rank, but it’s a notably smaller drop than most wealthy countries RYB has covered. Germany falls from 5th to 149th; Switzerland falls from 22nd to 166th. Japan’s spillover footprint, while real, is comparatively contained.
Weapons exports: near the lowest recorded
Japan exports major conventional weapons at just 0.017 TIV per 100,000 population — rated green, and one of the smallest figures RYB has recorded, close to Nigeria’s 0.002 and well below every European economy covered so far.
Plastic waste exports: moderate, and worth watching
Japan exports 4.88 kg of plastic waste per capita, rated orange. That’s roughly half of Germany’s 8.98 kg — the highest RYB has recorded — but still a meaningful figure, and one that sits in the same regional flow as the plastic waste crisis documented on Indonesia’s SDGs page.
A financial picture that’s hard to read from this data alone
Japan’s Corporate Tax Haven Score and its shifted-profits figure are both flagged as imputed in the underlying database rather than measured, so neither is cited here. Its Financial Secrecy Score, however, is real: 63 out of 100 (0 = best), rated red and declining — a genuine, measured weak point even where the tax haven figures aren’t available.
Why These Numbers Matter
A high overall SDG score measures how a country treats its own people. It says nothing about what that country’s economy asks of everyone else — the waste it exports, the weapons it sells, the profits that pass untaxed through its financial system. Japan’s numbers show a country whose spillover footprint, unlike several other wealthy economies RYB has covered, is genuinely more contained — though its Financial Secrecy Score suggests that containment isn’t complete.
RYB’s Place in This Picture
Japan’s spillover rank of 128th is meaningfully better than every European economy RYB has covered to date, though still a real gap from its domestic performance. See the full picture, ranked side by side, on RYB’s Global Responsibility page.
UNDP
Human Development Report — Japan
The Human Development Index measures something narrower and older than the SDGs: life expectancy, education, and income, combined into a single score, with no 2030 deadline attached. It is a different lens on the same country, worth reading alongside the SDG data above rather than instead of it.
Japan’s HDI is 0.925 (2023 data), ranking 23rd globally — “very high” tier, but noticeably behind the SDG Index ranking of 20th, and well behind Germany’s 5th-place HDI. Life expectancy of 84.7 years anchors the score; GNI per capita is $47,775. Adjusted for inequality, Japan’s HDI falls only slightly, to 0.845, a loss of 8.6% — and its inequality-adjusted rank actually improves by two places relative to its raw HDI rank, the opposite pattern from Germany, whose inequality-adjusted rank falls. In other words: whatever else is driving Japan’s middling overall SDG position, income and opportunity inequality by this measure isn’t the main culprit — gender gaps and environmental spillovers are doing more of that work.