
New Zealand Sustainable Development Goals (SDGs)
27 / 169
SDG Index Rank, 2026
79.51
SDG Index Score (out of 100)
145 / 169
Spillover Rank, 2026
65.50
Spillover Score (out of 100)
Source: Sustainable Development Report 2026, Sachs, J.D., Lafortune, G., Fuller, G., Iablonovski, G. Paris: SDSN, Dublin: Dublin University Press.
Most people have never heard of the Sustainable Development Goals in any real detail. Surveys across the US, UK, France, and Germany find only 8-12% of people can actually say what the SDGs are. RYB exists to close that gap, looking at the same reports and reviews the UN and researchers use, and explaining them as we go.
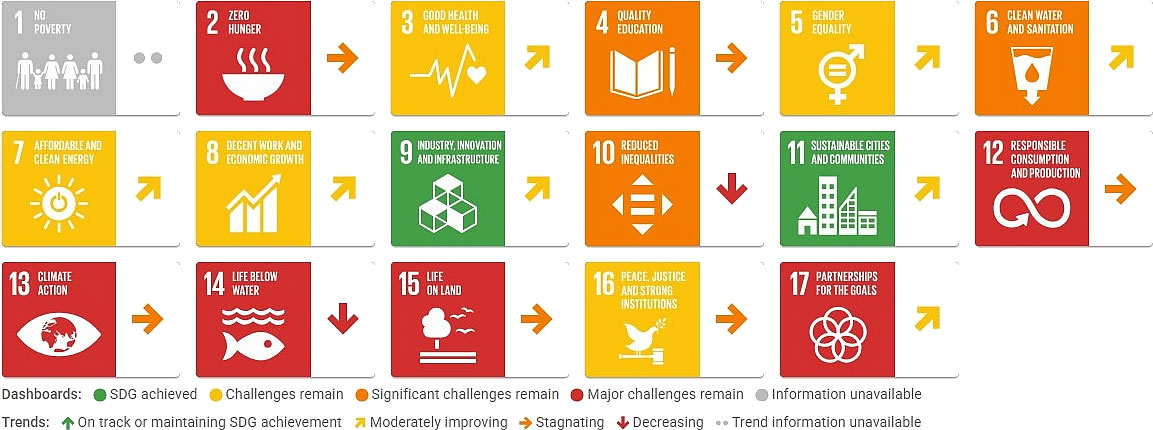
New Zealand ranks 27th out of 169 countries on the 2026 SDG Index — solid, but a country whose global brand runs on words like “clean” and “green” sits well behind Germany (5th) and even Japan (20th). The reason is almost entirely environmental: SDG 12, 13, 14, and 15 are all rated red. New Zealand shares one striking number with Japan, a country it has almost nothing else in common with on this index — both catch roughly 60% of their fish from overexploited or collapsed stocks. New Zealand’s own poverty data, meanwhile, is simply missing: the country doesn’t report against the international extreme-poverty line RYB’s other pages cite, leaving Goal 1 with no color rating at all.
New Zealand — Sustainable Development Report 2026
NZ
New Zealand’s SDG Story
New Zealand’s 79.51 score is built on a genuinely strong social floor: universal electricity, sanitation, and safely managed water; a Corruption Perceptions Index of 81, among the cleanest RYB has recorded; and one of the highest Statistical Performance Index scores (91.7) in this series — which makes the poverty data gap below all the more pointed, since it isn’t a capacity problem.
Where New Zealand leads: gender representation
SDG 5 (Gender Equality) rates yellow overall, but one number underneath it is remarkable: women hold 45.5% of seats in New Zealand’s parliament, rated green and among the highest RYB has recorded anywhere — well ahead of Germany’s 32.5% and more than double Japan’s 15.5%. The gender wage gap, at 8.2%, is also comparatively narrow. It’s a fitting number for the country that became the first in the world to grant women the vote, in 1893 — a history RYB covers in full on Culture Women’s Day New Zealand.
Where the “clean, green” brand meets red data
Four goals are rated red: SDG 12 (Responsible Consumption and Production), SDG 13 (Climate Action), SDG 14 (Life Below Water), and SDG 15 (Life on Land) — a harder combination to find than any single red goal, and a pointed one for a country whose tourism board has marketed itself as “100% Pure” for over two decades. Only 47.2% of marine sites important to biodiversity are protected, and just 46.3% of terrestrial sites and 24.5% of freshwater sites are protected, all rated red. The Red List Index of species survival is declining. On production, obesity (33.6% of adults) and hazardous pesticide exports both rate red, and electronic waste that goes uncollected is a further red mark.
A poverty measure with no data at all
Goal 1 is the one goal on New Zealand’s dashboard with no color at all — grey, for missing data. New Zealand doesn’t report figures against the international $3-a-day extreme poverty line the SDR uses, a gap UNDP’s own Human Development Report has separately flagged when compiling New Zealand’s inequality data. It isn’t that New Zealand lacks poverty data domestically — Stats NZ tracks poverty after housing costs closely — it’s that the specific international measure this index relies on isn’t submitted. One domestic figure that is captured tells its own story: elderly poverty stands at 33.7%, rated red and the highest elderly poverty rate RYB has recorded among wealthy countries so far.
Voluntary National Reviews and National Implementation
One VNR, seven years ago
New Zealand has presented exactly one Voluntary National Review to the UN High-Level Political Forum, in July 2019, titled He waka eke noa — a Māori proverb meaning “we are all in this together.” No second VNR has followed as of 2026, which is unusual: most OECD peers RYB has covered, including Germany and Japan, have each presented three. Seven years is a long gap for a country ranked in the SDG Index’s top 30 to go without a formal national stocktake.
A people’s report the government didn’t write
What New Zealand lacks in VNR frequency, civil society partly filled in 2019: alongside the official government review, a coalition led by Hui E! Community Aotearoa published a parallel “People’s Report” on the SDGs, funded in part by the New Zealand National Commission for UNESCO. The report explicitly wove the SDGs together with Te Tiriti o Waitangi (the Treaty of Waitangi) and the Māori concept of kaitiakitanga — guardianship of the natural environment — arguing that genuine progress on the Global Goals in New Zealand has to be read through that lens, not just the government’s own Living Standards Framework. It’s a distinctive model of localization RYB hasn’t found in quite this form elsewhere: not a city-level VLR, but a nationwide, indigenous-framed shadow review sitting alongside the official one.

What the SDR Shows: International Spillovers
The Sustainable Development Report scores every country two ways. The overall score measures how well a country is doing for its own people. The spillover score measures how much harm a country’s economy causes everyone else.
New Zealand’s spillover rank of 145th out of 169 is a steep fall from its 27th-place overall rank — worse than Japan’s 128th, though still well ahead of Germany’s 149th.
A relatively light footprint on weapons and plastic
New Zealand exports major conventional weapons at just 0.471 TIV per 100,000 population, rated yellow — a fraction of Germany’s 2.09 or Italy’s 2.68. Plastic waste exports, at 4.76 kg per capita, rated orange, sit close to Japan’s 4.88 kg and well below Germany’s 8.98 kg, the highest RYB has recorded.
Development aid falling short of the UN target
New Zealand’s international concessional public finance — development aid, effectively — comes to just 0.27% of gross national income, rated red and declining. The internationally agreed UN target is 0.7%. For a country that positions itself as a Pacific regional leader, that gap is a meaningful part of its spillover story.
A financial secrecy score that’s real, even where the tax haven score isn’t
New Zealand’s Corporate Tax Haven Score in the underlying database is flagged as imputed rather than measured, so it isn’t cited here. Its Financial Secrecy Score, however, is real: 66 out of 100 (0 = best), rated red and declining — a genuine, measured weak point in New Zealand’s financial transparency, independent of the tax haven figure.
Why These Numbers Matter
A high overall SDG score measures how a country treats its own people. It says nothing about what that country’s economy asks of everyone else — the aid it withholds, the financial secrecy it tolerates, the waste it exports. New Zealand’s spillover numbers are a reminder that a small population and a clean domestic reputation don’t automatically translate into a light international footprint.
RYB’s Place in This Picture
New Zealand’s spillover rank of 145th sits between Japan’s 128th and Germany’s 149th — a reminder that this pattern isn’t limited to the largest economies RYB has covered. See the full picture, ranked side by side, on RYB’s Global Responsibility page.
UNDP
Human Development Report — New Zealand
The Human Development Index measures something narrower and older than the SDGs: life expectancy, education, and income, combined into a single score, with no 2030 deadline attached. It is a different lens on the same country, worth reading alongside the SDG data above rather than instead of it.
New Zealand’s HDI is 0.938 (2023 data), ranking 17th globally — “very high” tier, ahead of Japan’s 23rd though behind Germany’s 5th. Life expectancy stands at 82.4 years. Regionally, the spread is wide: Wellington’s HDI (0.968) is comparable to Switzerland, while Gisborne (0.896) sits closer to Lithuania — a gap of more than 20 places in the global rankings within one small country.
New Zealand’s Human Development Index data →
What is the difference between the HDI and the SDGs? →
Sources
- Sustainable Development Report 2026, New Zealand — SDSN
- New Zealand — UN High-Level Political Forum
- New Zealand’s Voluntary National Review 2019 — Ministry of Foreign Affairs and Trade
- The People’s Report on the 2030 Agenda and Sustainable Development Goals — Hui E! Community Aotearoa
- UNDP Human Development Report 2025 — Country Insights