

Germany Sustainable Development Goals (SDGs)
5 / 169
SDG Index Rank, 2026
84.02
SDG Index Score (out of 100)
149 / 169
International Spillover Rank, 2026
63.27
International Spillover Score (out of 100)
Source: Sustainable Development Report 2026, Sachs, J.D., Lafortune, G., Fuller, G., Iablonovski, G. Paris: SDSN, Dublin: Dublin University Press.
Most people have never heard of the Sustainable Development Goals in any real detail. Surveys across the US, UK, France, and Germany find only 8-12% of people can actually say what the SDGs are. RYB exists to close that gap, looking at the same reports and reviews the UN and researchers use, and explaining them as we go.
Germany ranks 5th out of 169 countries on the 2026 SDG Index, tied on score with Sweden and trailing only Iceland, Norway, Switzerland, and Denmark. But its spillover rank tells a different story: 149th out of 169. Nowhere is that gap more visible than in a single indicator: Germany exports 8.98 kg of plastic waste per capita, the highest figure RYB has recorded for any country to date, ahead of Poland (3.89 kg) and Italy (3.65 kg). Indonesia’s own SDGs page already names Germany as one of the rich-country suppliers whose plastic scrap ends up dumped or burned in East Java villages. Germany’s domestic SDG record is excellent by almost every measure. What it exports, financially and physically, is a separate question.
Germany — Sustainable Development Report 2026
DE
Germany’s SDG Story
Germany’s overall SDG Index score of 84.02 puts it among the world’s top five performers, built on near-complete coverage of the basics: universal access to electricity, clean cooking fuel, and basic sanitation; a maternal mortality ratio of 3.6 per 100,000 births; and a life expectancy of 81.7 years. Statistical capacity is also a strength — Germany’s Statistical Performance Index of 90.06 is one of the highest RYB has recorded, meaning the country’s own data on itself is unusually reliable.
Where Germany is on track
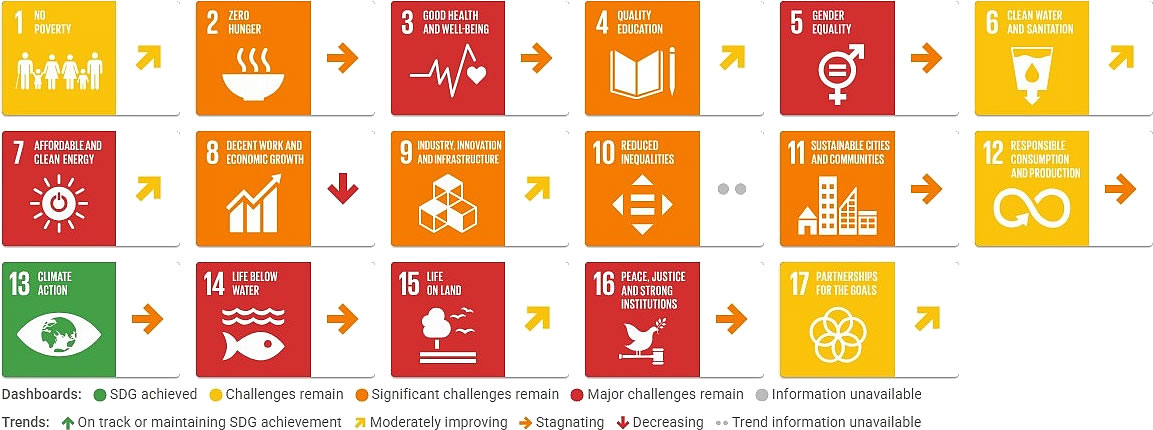
SDG 11 (Sustainable Cities and Communities) is the one goal rated green on Germany’s dashboard, and it is improving. That mirrors Italy, whose SDGs page also names SDG 11 as its lone green, on-track goal — an unusual pairing of two large, dense, historically car-oriented economies both making visible progress on urban sustainability while struggling elsewhere.
Where the dashboard turns red
Two goals are rated red for Germany: SDG 12 (Responsible Consumption and Production) and SDG 13 (Climate Action). Underneath SDG 12 sit some of the more striking numbers on this page — the plastic waste export figure above, plus nitrogen emissions embodied in imports (48.26 kg/capita, red) and air pollution associated with imports (red). Underneath SDG 13, Germany’s CO2 emissions from fossil fuels and cement run to 6.76 tonnes per capita, still rated red despite a slowly improving trend.
Two goals moving the wrong way
SDG 1 (Poverty) and SDG 10 (Inequality) are both trending down — worth pausing on, since Germany has all but eliminated extreme poverty (99.8/100 on the international $3/day line). The decline shows up instead in the OECD’s own relative measure: 11.6% of the population is poor after taxes and transfers, and that share is rising. The inequality picture is consistent with it — a Gini coefficient of 32.4 and a Palma ratio both moving in the wrong direction, alongside elderly poverty (13.1%) that is also increasing. Germany’s overall wealth is not the story here; how it’s distributed, and to whom, increasingly is.

Voluntary National Reviews and National Implementation
Three VNRs, a decade apart in tone
Germany has presented three Voluntary National Reviews to the UN High-Level Political Forum: 2016 (its first, one year after the 2030 Agenda was adopted), 2021 (explicitly framed around lessons learned from the first five years and the new national Sustainability Strategy adopted that March), and 2025 (its third, covering 2021-2025, built through what Germany describes as its broadest stakeholder participation process yet, spanning the federal states, municipalities, civil society, business, academia, and youth).
The strongest municipal reporting record RYB has seen
Germany’s Voluntary Local Review history is unusually deep. Mannheim published Germany’s first VLR in 2019, followed by Bonn in 2020, then Düsseldorf and Kiel in 2022, then a wave of six more cities and one county (Bad Köstritz, Freiburg, the Landkreis Fürstenfeldbruck, Hamburg, Cologne, and Stuttgart) in 2023, with Kiel and Münster adding updated reports in 2024. By 2025 this had scaled into something no other country covered by RYB has yet built: a national Voluntary Local Government Review, compiled by the Deutsches Institut für Urbanistik with contributions from 15 municipalities, explicitly designed to feed a coordinated local voice directly into Germany’s third VNR. Where Italy’s Lombardy region folded one regional VLR into its national review, Germany has built a standing pipeline connecting dozens of cities to the national process.
What the SDR Shows: International Spillovers
The Sustainable Development Report scores every country two ways. The overall score measures how well a country is doing for its own people. The spillover score measures how much harm a country’s economy causes everyone else.
Germany’s spillover rank of 149th out of 169 is a sharp drop from its 5th-place overall rank — not as severe as the Netherlands’ 167th or Switzerland’s 166th, but a serious gap for an economy this large. Three indicators drive it:
Plastic waste exports: the highest RYB has recorded
At 8.98 kg per capita, Germany’s plastic waste exports are rated red and are the highest figure in any country page RYB has published. The Indonesia SDGs page already documents where a meaningful share of this ends up: field reporting from Ecoton found EU-sourced plastic scrap, including from Germany, dumped in East Java villages or burned as tofu-boiler fuel rather than recycled. Indonesia stopped approving new plastic waste imports in 2025; the EU’s own Waste Shipment Regulation will bar such exports to non-OECD countries from November 2026. Germany’s export volume predates both changes.
Weapons exports: third-highest recorded
Germany exports major conventional weapons at a rate of 2.09 TIV per 100,000 population, rated red. That’s below Italy (2.68) and the United States (3.77), the two highest RYB has recorded, but still a meaningful spillover driver in its own right, and the indicator’s trend is moving in the wrong direction.
A mixed financial picture
Germany’s Corporate Tax Haven Score is 55 out of 100 (0 = best) — a real, measured figure, not one of the default-imputed scores that have shown up on some other countries’ pages. It rates green on RYB’s dashboard: moderate, and notably better than Switzerland’s 89. But Germany’s Financial Secrecy Score, a related but separate measure, is 59 and rates red — a reminder that a country can look relatively clean on one financial spillover indicator and not on the other. (Germany’s “shifted profits of multinationals” figure in the underlying database is flagged as imputed rather than measured, so it isn’t cited here.)
Why These Numbers Matter
A high overall SDG score measures how a country treats its own people. It says nothing about what that country’s economy asks of everyone else — the waste it exports, the weapons it sells, the profits that pass untaxed through its financial system. Germany’s numbers are a clear case of both things being true at once: a country doing very well by its own population, and a country whose international footprint tells a separate, less flattering story.
RYB’s Place in This Picture
Germany’s spillover rank sits in the same range as most large, wealthy European economies RYB has covered — worse than Poland’s 127th, but well ahead of the Netherlands’ 167th and Switzerland’s 166th. The pattern across all of them is consistent: high domestic scores rarely predict a clean international footprint. See the full picture, ranked side by side, on RYB’s Global Responsibility page.
UNDP
Human Development Report — Germany
The Human Development Index measures something narrower and older than the SDGs: life expectancy, education, and income, combined into a single score, with no 2030 deadline attached. It is a different lens on the same country, worth reading alongside the SDG data above rather than instead of it.
Germany’s HDI is 0.959 (2023 data), tying it for 5th place globally with Sweden — just behind Denmark and just ahead of Australia. Life expectancy stands at 81.4 years, with 17.3 expected years of schooling. Notably, Germany’s income rank is 13 places lower than its HDI rank, meaning the country converts its income into life expectancy, education, and wellbeing more effectively than its GNI per capita alone would predict. Adjusted for inequality, Germany’s HDI falls to 0.890, a 7.2% loss — modest by global standards, though enough to knock Germany three places down the inequality-adjusted ranking, with the richest 1% holding 12.8% of national income. Regionally, the spread is wide: Hamburg’s HDI (0.977) is comparable to Iceland, the single highest HDI in the world, while Saxony-Anhalt (0.930) sits closer to Austria — a 20-tier gap in living standards within one country.
Germany’s Human Development Index data →
What is the difference between the HDI and the SDGs? →