

Indonesia Sustainable Development Goals (SDGs)
74
SDG Index rank, out of 169 countries
70.81
SDG Index score, out of 100
32
Spillover rank, out of 169 countries
94.81
Spillover score, out of 100
Source: Sustainable Development Report 2026, SDSN / Dublin University Press
Most people have never heard of the Sustainable Development Goals in any real detail. Surveys across the US, UK, France, and Germany find only 8–12% of people can actually say what the SDGs are. RYB exists to close that gap, looking at the same reports and reviews the UN and researchers use, and explaining them as we go.
Indonesia’s own Sustainable Development Report dashboard rates its plastic waste spillover indicator green, because that measure only tracks what a country exports abroad, and Indonesia exports very little. Read on its own, that would suggest plastic isn’t one of Indonesia’s problems. It’s the opposite: separate research consistently ranks Indonesia among the top handful of countries contributing plastic to the world’s oceans, a domestic mismanaged-waste crisis the SDR’s own export-focused indicator simply isn’t built to catch.
Indonesia — Sustainable Development Report 2026
ID
Voluntary National Reviews: Four Reviews, the Most Consistent Record RYB Has Tracked
Indonesia has presented four Voluntary National Reviews, in 2017, 2019, 2021, and 2025, one of the most consistent reporting records of any country RYB has covered so far. The 2017 review marked Indonesia as a pioneer among early SDG reporters; the 2019 review, themed around empowerment and inclusiveness, described the SDGs woven into national and subnational planning for “264 million people… comprising 1,300 ethnic groups across 17,000 islands”; the 2021 review, delivered through online consultations during the pandemic, focused on social protection, health system, and disaster-resilience reforms.
The fourth VNR, presented in July 2025, reports that 61.4% of Indonesia’s 233 national SDG indicators are on track for 2030, a figure the government describes as “far exceed[ing] the global average,” and frames the review around continuity following the country’s 2024 democratic transition.
Voluntary Local Reviews: Two Cities, Same Year, Same Crisis
DKI Jakarta Province and the City of Surabaya both published Voluntary Local Reviews in 2021, developed with UNESCAP, UCLG ASPAC, and the Asian Development Bank. Both reviews were shaped heavily by the same event: Jakarta’s, subtitled “Rise toward a Resilient Jakarta,” and Surabaya’s both built their SDG progress reporting directly around COVID-19 recovery, tracking how the pandemic had reversed gains on employment, poverty, and health access in each city before either had time to publish a review free of it.

What the Sustainable Development Report Shows: Domestic Weakness, Low International Harm
The Sustainable Development Report scores every country two ways. The overall score measures how well a country is doing for its own people. The spillover score measures how much harm a country’s economy causes everyone else.
Indonesia’s overall score sits at 70.81 out of 100, ranking 74th out of 169 countries, the lowest overall rank of any country RYB has covered on this site so far. Its spillover score sits at 94.81 out of 100, ranking 32nd, the strongest spillover position RYB has recorded outside Brazil’s 6th place. The pattern is now a familiar one on this site: large, lower-income economies with less trade and financial exposure abroad tend to rank far better on spillovers than on their own domestic SDG progress.
Why Indonesia’s Spillover Score Holds Up
- Weapons exports are close to zero. At 0.006 TIV per 100,000 people, Indonesia’s figure is the lowest RYB has recorded for any country, well below Bosnia and Herzegovina’s 0.14 or Brazil’s 0.038, and a fraction of the US’s 3.773.
- Support for UN-based multilateralism is solid. Indonesia’s score sits at 69.2 out of 100, just ahead of Bosnia and Herzegovina’s 69.0, behind Brazil’s 81.6, and far ahead of the US’s 1.7.
- The SDR’s own plastic waste export indicator rates green, at 0.135 kg per capita, lower than Bosnia and Herzegovina (0.905 kg), Bulgaria (2.507 kg), or Poland (3.885 kg). As the section below explains, this measures a different thing entirely from the plastic problem Indonesia is actually known for.
Where the Work Remains
This is the gap worth naming plainly: Indonesia generates roughly 7.8 million metric tonnes of plastic waste a year, and independent research puts around 4.9 million tonnes of it as mismanaged, uncollected, openly dumped, or leaking from poorly managed sites. Estimates consistently place Indonesia among the world’s top handful of contributors to ocean plastic, with over a million tonnes reaching the sea annually. None of that shows up in the SDR’s own plastic indicator, because that indicator only tracks exports, and Indonesia exports very little of its own plastic waste. If anything, the flow runs the other way: Indonesia has become a net importer of plastic waste from wealthier countries, a shift that accelerated after China closed its own imports in 2018.
Plastic waste: how it physically works
The mechanics of that import trade are worth spelling out. It’s a real, priced commodity market, not scrap hidden in returning shipping containers: in 2024, Indonesia imported 262,900 tonnes of plastic waste, worth roughly $105 million, a 4% rise on 2023. The Netherlands is consistently the largest single supplier, sending well over 100,000 tonnes most years, ahead of Germany and Belgium. European recyclers export this material largely, because it’s the plastic hardest to recycle profitably at home, mixed or low-grade scrap that needs manual sorting, and it’s cheaper to ship it to a country with lower labor and processing costs than to sort it domestically. Reporting from Break Free From Plastic in December 2025 found this pattern accelerating rather than easing: as EU plastic exports to the Netherlands, Turkey, and Poland have fallen, exports to Indonesia, Malaysia, and Vietnam have risen in their place.
Health and environmental costs of plastic waste
What happens to it once it arrives is where the official story and the reporting on the ground diverge. Officially, most imported scrap feeds Indonesia’s own recycling industry, cheaper raw material than virgin plastic. Field research published by Ecoton in May 2025 found a messier reality: much of the lowest-grade material is effectively unsellable, and ends up dumped in village-adjacent sites in East Java, or burned directly as boiler fuel by small-scale tofu producers, whose product then absorbs the toxic smoke, with air quality in the affected villages measured well past safe thresholds. Importers and recyclers profit from the cheap feedstock; the health and environmental costs land on the rural communities near the processing sites, not on whoever profits from the trade.
Regulation
Indonesia’s government moved to close this off entirely in late 2024, announcing a halt to all plastic waste import approvals starting in 2025, with the Environment Minister stating that the country already has enough plastic sitting in its own landfills to sort and recycle instead. Separately, the EU’s own Waste Shipment Regulation will bar EU countries from exporting plastic waste to non-OECD countries at all from November 2026, unless the receiving country opts in and can demonstrate it can handle it sustainably, a restriction that would close this route from the supply side as well.
No green ratings
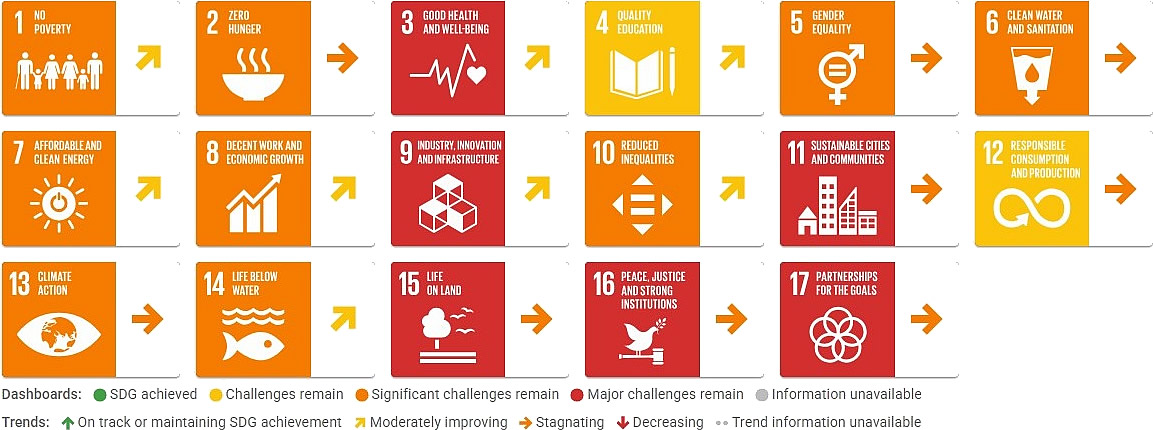
On the dashboard itself, Indonesia carries no green ratings at all, the only country RYB has covered with that distinction. Good Health and Well-Being (SDG 3), Industry, Innovation and Infrastructure (SDG 9), Sustainable Cities and Communities (SDG 11), Life on Land (SDG 15), Peace, Justice and Strong Institutions (SDG 16), and Partnerships for the Goals (SDG 17) all rate the dashboard’s worst color, red. Indonesia’s Corruption Perceptions Index score, 34 out of 100, sits level with Bosnia and Herzegovina’s.
Indonesia’s spillover rank sits alongside every other country RYB tracks on the Global Responsibility page, where rankings like these are shown together across all the countries covered on this site.
Why These Numbers Matter
These pages matter more than their topic suggests on the surface. The SDGs are, in effect, the world’s working roadmap for its biggest shared problems, yet most citizens have never engaged with them directly. A Voluntary Local Review can change that at the scale where it’s most achievable: one city, one community, people who might otherwise never cross paths brought into the same conversation about what their home needs most.
Culture and the arts barely feature in Indonesia’s own VNRs or in Jakarta and Surabaya’s VLRs, both of which were consumed almost entirely by pandemic recovery. RYB tracks Indonesia because a Culture of Peace lens has room to add something real to a country whose SDG story right now is being told almost entirely through economic and public-health data.
RYB’s Place in This Picture
RYB tracks Indonesia because its numbers illustrate exactly the kind of gap a single dashboard color can hide. A green rating on plastic waste exports looks, on its own, like good news. Read against independent research on Indonesia’s own marine plastic pollution, it looks like the opposite: a country whose real plastic problem is domestic mismanagement, not something the SDR’s international spillover framework was built to capture at all.
Looking Forward
Watch whether Indonesia’s National Plastic Action Plan and its circular-economy roadmap for 2025–2045 move the country’s mismanaged-waste figures in a way that eventually shows up in international data, even if the SDR’s own indicator won’t be the one to reflect it. Watch the fifth VNR, expected around 2027, for whether the 61.4%-on-track figure from 2025 holds. And watch whether any other Indonesian city follows Jakarta and Surabaya’s 2021 lead with a Voluntary Local Review built around something other than pandemic recovery.
Human Development Report — Indonesia
The Human Development Index measures something narrower and older than the SDGs: life expectancy, education, and income, combined into a single score, with no 2030 deadline attached. It is a different lens on the same country, worth reading alongside the SDG data above rather than instead of it.
Indonesia’s HDI reached 0.728 in 2023, up from 0.713 the year before, and sits in the “high human development” category, the tier below “very high” that every other country RYB has covered so far sits in. Indonesia only crossed into “high” human development in 2018, a milestone UNDP itself called historic at the time. Indonesia’s own national statistics agency calculates HDI differently, on a 0-100 scale, reporting a 2023 score of 74.39, still on the same upward trend as the UNDP figure.
Indonesia’s Human Development Index data →
What is the difference between the HDI and the SDGs? →
Sources
- SDG Index database, Sustainable Development Report 2026 — Fuller, G., Iablonovski, G., Lafortune, G. and Sachs, J.D. (2026), SDSN / Dublin University Press, DOI:10.82163/225
- Sustainable Development Report 2026, Indonesia profile — dashboards.sdgindex.org
- Voluntary National Review 2025, Indonesia, Main Messages — hlpf.un.org
- Voluntary National Review 2019, Indonesia — hlpf.un.org
- DKI Jakarta Province Voluntary Local Review 2021 — unhabitat.org
- Surabaya City Voluntary Local Review 2021 — sdgs.un.org
- Indonesia’s struggle with plastic waste, IUCN NL — iucn.nl
- Indonesia bets on “reuse” to curb plastic waste, Mongabay — news.mongabay.com
- Not Our Trash: Indonesia’s Struggle with the World’s Plastic Waste, Heinrich Böll Foundation — th.boell.org
- Not Our Trash: Indonesia’s Struggle with World’s Plastic Waste, FairPlanet — fairplanet.org
- Waste Colonialism: Germany’s Role in the Global Plastic Trade, Break Free From Plastic — breakfreefromplastic.org
- Indonesia Ends Plastic Waste Imports Amid Growing Environmental Concerns, Seasia.co — seasia.co
- Which European countries are the largest exporters of plastic waste?, Euronews — euronews.com
- Indonesia breaks into high human development category group, UNDP — undp.org
- Indonesia’s Human Development Index in 2023, BPS-Statistics Indonesia — bps.go.id