

India Sustainable Development Goals (SDGs)
94
SDG Index rank, out of 169 countries
68.33
SDG Index score, out of 100
13
Spillover rank, out of 169 countries
95.74
Spillover score, out of 100
Source: Sustainable Development Report 2026, SDSN / Dublin University Press
Most people have never heard of the Sustainable Development Goals in any real detail. Surveys across the US, UK, France, and Germany find only 8–12% of people can actually say what the SDGs are. RYB exists to close that gap, looking at the same reports and reviews the UN and researchers use, and explaining them as we go.
India, home to more people than any other country on Earth, ranks 94th out of 169 on the Sustainable Development Report, the lowest overall position of any country RYB has covered on this site so far. Its spillover rank tells the opposite story: 13th, the strongest spillover position RYB has recorded after only Brazil’s 6th. India’s own domestic SDG India Index, run separately by the national government, tells a third story again, one of the more encouraging trend lines RYB has come across: a national score that has climbed from 58 in 2018 to 71 in 2023-24. Three different numbers, three different pictures of the same country.
India — Sustainable Development Report 2026
IN
India and the Sustainable Development Goals
India is strongly committed to achieving the UN Sustainable Development Goals (SDGs), a set of 17 goals designed to address global challenges such as poverty, inequality, climate change, environmental degradation, peace, and justice by 2030. The Indian government has integrated these goals into national policies and development agendas, working across various sectors to promote sustainable development.
Voluntary National Reviews: Three Reviews, Building a Domestic Index Alongside Them
India has presented three Voluntary National Reviews, in 2017, 2020, and 2025, each steered by NITI Aayog, the government’s central policy think tank. The 2020 review described a deliberate “whole-of-society” shift, actively engaging state and local governments, civil society, and the private sector rather than treating the SDGs as a purely national-government exercise.
The third VNR, presented in July 2025, reports that around 248 million people are estimated to have escaped multidimensional poverty between 2013-14 and 2022-23, alongside declines in out-of-pocket health expenditure, from 48.8% of total health spending in 2017-18 to 39.4% by 2020-21, and continued rollout of clean-energy missions. Running in parallel to the VNRs, NITI Aayog’s own SDG India Index has become the country’s main subnational tracking tool, scoring every state and union territory annually. Kerala and Uttarakhand share the top spot in the 2023-24 edition, while Bihar, Jharkhand, Meghalaya, and Nagaland sit at the bottom.
Voluntary Local Reviews: Bhopal Goes First
The city of Bhopal launched India’s first city-level Voluntary Local Review in May 2023, “An Agenda for Action: Sustainable Urban Transformation in Bhopal,” developed with UN-Habitat and more than 23 local stakeholders. The review combined qualitative mapping of 56 development projects across three pillars, People, Planet, and Prosperity, with an in-depth quantitative assessment of SDG 11, Sustainable Cities and Communities, specifically.

What the Sustainable Development Report Shows: A Low Domestic Score, A Very Low International Footprint
The Sustainable Development Report scores every country two ways. The overall score measures how well a country is doing for its own people. The spillover score measures how much harm a country’s economy causes everyone else.
India’s overall score sits at 68.33 out of 100, ranking 94th out of 169 countries. Its spillover score sits at 95.74 out of 100, translating to a rank of 13th, the second-strongest spillover position RYB has recorded on this site, behind only Brazil. As with Indonesia, the pattern holds: a very large, lower-income economy with comparatively little trade and financial exposure abroad tends to do far less measurable harm internationally than its overall SDG score alone would suggest.
Why India’s Spillover Score Is So Strong
- Weapons exports are close to zero. At 0.004 TIV per 100,000 people, India’s figure is the lowest RYB has recorded for any country, even lower than Indonesia’s 0.006, and a small fraction of the US’s 3.773.
- Plastic waste exports are effectively negligible. At 0.003 kg per capita, India’s figure is again the lowest RYB has recorded, lower than Indonesia’s own low 0.135 kg, and far below the Netherlands’ 30.162 kg.
- Support for UN-based multilateralism is solid. India’s score sits at 65.1 out of 100, ahead of Poland (56.5) and the UK (54.9), though behind Bosnia and Herzegovina (69.0) and Brazil (81.6).
Where the Work Remains
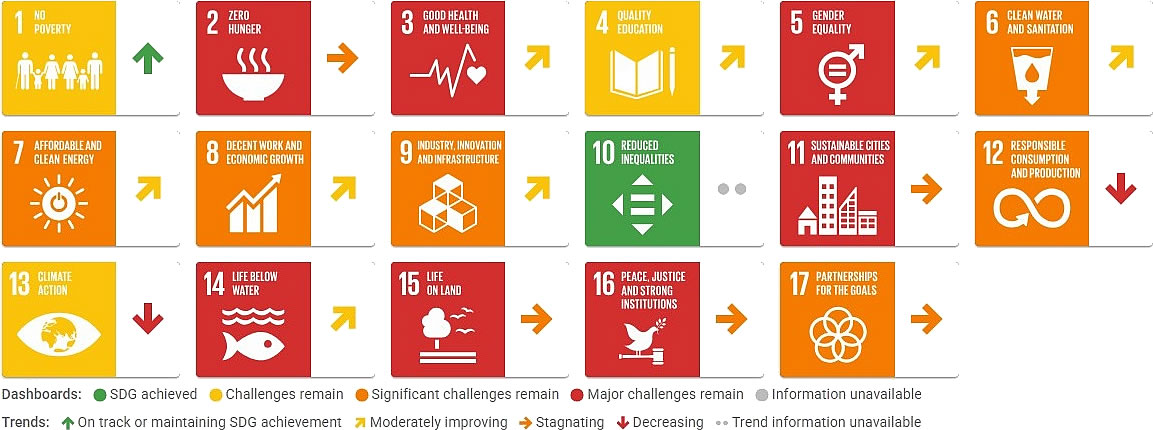
India’s Statistical Performance Index sits at 73.7 out of 100, and its Corruption Perceptions Index score at 39 out of 100, both roughly mid-pack against the other countries RYB has covered. The dashboard’s real weight sits elsewhere: Zero Hunger (SDG 2), Good Health and Well-Being (SDG 3), Gender Equality (SDG 5), Sustainable Cities and Communities (SDG 11), Life Below Water (SDG 14), Life on Land (SDG 15), and Peace, Justice and Strong Institutions (SDG 16) all rate the dashboard’s worst color, red, more red ratings than any other country RYB has covered so far. Responsible Consumption and Production (SDG 12) and Climate Action (SDG 13) are both currently trending backward rather than holding steady, two goals moving the wrong way at once, also more than RYB has seen on any single dashboard to date.
One figure is worth naming on its own: India’s annual mean PM2.5 concentration sits at 47.1 μg/m³, nearly ten times the World Health Organization’s guideline of 5 μg/m³, and by a wide margin the worst air-quality figure of any country RYB has covered. Reduced Inequalities (SDG 10), by contrast, rates green, built on a Gini coefficient of 25.5 that reads low next to most other estimates of income inequality in India, a reminder that a single headline number can undersell a real, well-documented gap the same way a single number oversold Indonesia’s plastic performance on the previous page.
India’s spillover rank sits alongside every other country RYB tracks on the Global Responsibility page, where rankings like these are shown together across all the countries covered on this site.
Why These Numbers Matter
These pages matter more than their topic suggests on the surface. The SDGs are, in effect, the world’s working roadmap for its biggest shared problems, yet most citizens have never engaged with them directly. A Voluntary Local Review can change that at the scale where it’s most achievable: one city, one community, people who might otherwise never cross paths brought into the same conversation about what their home needs most.
Culture and the arts barely feature in India’s VNRs or in Bhopal’s own review, built instead around infrastructure, poverty, and health data. RYB tracks India because a Culture of Peace lens has genuine room to add something to a country whose SDG story is being told, so far, almost entirely through economic and administrative numbers, at a scale, over a billion people, where that story is really several hundred different state-level stories at once.
RYB’s Place in This Picture
RYB tracks India because no other country on this site produces three such different numbers about itself at once: a global SDG rank in the 90s, a spillover rank in the teens, and a fast-rising domestic index that reads nothing like either. None of the three is wrong. Together, they argue that a country this large resists being reduced to any single ranking, global or domestic, taken on its own.
Looking Forward
Watch whether India’s SDG India Index keeps climbing at the same pace it has since 2018, and whether that domestic progress eventually narrows the gap with its much lower global SDR rank. Watch the SDG 12 and SDG 13 trends specifically, the two goals currently moving backward on India’s dashboard. And watch whether more Indian cities follow Bhopal’s 2023 lead with Voluntary Local Reviews of their own.
Human Development Report — India
The Human Development Index measures something narrower and older than the SDGs: life expectancy, education, and income, combined into a single score, with no 2030 deadline attached. It is a different lens on the same country, worth reading alongside the SDG data above rather than instead of it.
India’s HDI reached 0.685 in 2023, up from 0.676 the year before, and now ranks 130th out of 193 countries, still in the “medium human development” category, the only country RYB has covered so far that hasn’t yet reached “high” or “very high” tier, though it is edging closer to the 0.700 threshold for “high.” Adjusted for inequality, the picture changes substantially: India’s Inequality-adjusted HDI reflects a 30.7% loss, one of the steepest discounts in the region, worth reading in full on UNDP’s own page.
Sources
- SDG Index database, Sustainable Development Report 2026 — Fuller, G., Iablonovski, G., Lafortune, G. and Sachs, J.D. (2026), SDSN / Dublin University Press, DOI:10.82163/225
- Sustainable Development Report 2026, India profile — dashboards.sdgindex.org
- Voluntary National Review 2020, India — hlpf.un.org
- NITI Aayog presents India’s Third Voluntary National Review at HLPF 2025, Vision IAS — visionias.in
- SDG India Index 2023-24, NITI Aayog, via India Briefing — india-briefing.com
- Bhopal launches India’s first city-level Voluntary Local Review, UN India — india.un.org
- India’s human development continues to make progress, ranks 130 out of 193 countries, UNDP — undp.org