

Malaysia Sustainable Development Goals (SDGs)
76 / 169
SDG Index Rank, 2026
70.38
SDG Index Score (out of 100)
109 / 169
Spillover Rank, 2026
86.16
Spillover Score (out of 100)
Source: Sustainable Development Report 2026, Sachs, J.D., Lafortune, G., Fuller, G., Iablonovski, G. Paris: SDSN, Dublin: Dublin University Press.
Most people have never heard of the Sustainable Development Goals in any real detail. Surveys across the US, UK, France, and Germany find only 8-12% of people can actually say what the SDGs are. RYB exists to close that gap, looking at the same reports and reviews the UN and researchers use, and explaining them as we go.
Malaysia ranks 76th out of 169 countries on the 2026 SDG Index — modest, well behind the wealthy economies RYB has covered so far. But its spillover score tells a different, more flattering story: 86.16 out of 100, ranked 109th, genuinely better than every high-income country RYB has reviewed to date, including Japan (73.53) and New Zealand (65.50). It’s a pattern worth sitting with: the countries with the most room left domestically are, in Malaysia’s case, doing comparatively little harm to everyone else. Extreme poverty is also close to eliminated, at just 0.2% of the population — but that success sits uneasily next to child stunting rates of 21.2%, both rated on the same dashboard.
Malaysia — Sustainable Development Report 2026
MY
Malaysia’s SDG Story
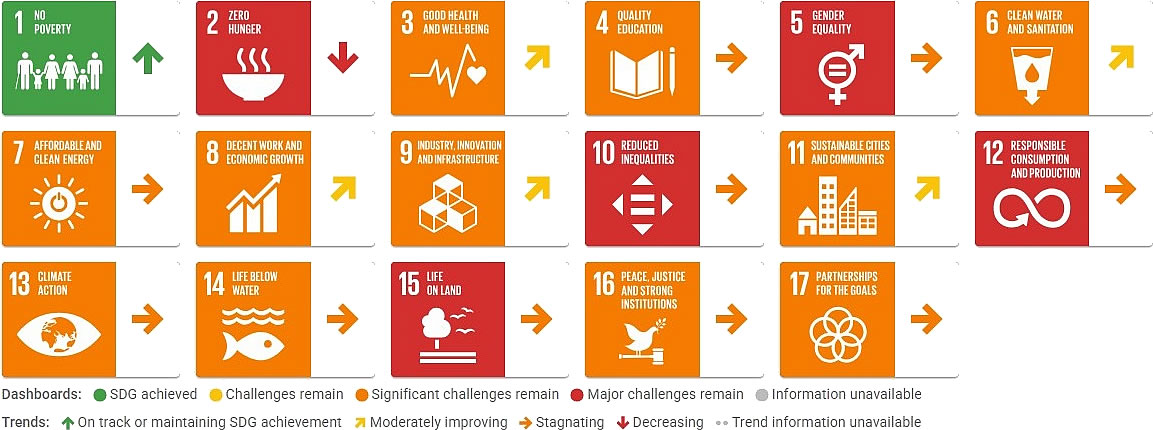
Malaysia’s overall score of 70.38 reflects a country that has moved fast on income poverty and slower on almost everything layered on top of it. Goal 1 is the one goal rated green on Malaysia’s dashboard, and it’s a genuine achievement: the poverty headcount ratio at the international $3-a-day line stands at just 0.2%, essentially eliminated. Multilateral cooperation is also a strength — Malaysia’s support for UN-based multilateralism scores 83.3, rated green, among the higher figures RYB has recorded.
A nutrition gap that poverty numbers don’t show
SDG 2 (Zero Hunger) is rated red and declining, which sits awkwardly next to the poverty picture above. Child stunting affects 21.2% of children under five, and wasting affects 11%, both rated red — a reminder that eliminating extreme income poverty doesn’t automatically fix nutrition, particularly in lower-income households and among the B40 income group the government’s own VNR has flagged as vulnerable.
Inequality and gender: two goals rated red
SDG 10 (Inequality) is red, with a Gini coefficient of 40.7 and a Palma ratio of 1.919 — both worse than most wealthy countries RYB has covered. SDG 5 (Gender Equality) is also red: just 13.6% of parliamentary seats are held by women, and demand for family planning satisfied by modern methods sits at only 34.3%, also rated red. RYB’s forthcoming Gender Gap Malaysia page will go deeper into both figures.
Deforestation and biodiversity: the clearest environmental red flag
SDG 15 (Life on Land) is rated red, anchored by a permanent deforestation rate of 0.9% of forest area a year — a meaningful figure for a country whose palm oil and timber industries have long been tied to land clearing — alongside terrestrial (37.0%) and freshwater (32.5%) biodiversity protection that both rate red. Renewable energy share in final consumption is just 7.1%, also red, low even by the standards of countries RYB has covered so far.
A brighter picture in the ocean
Not every environmental number points the same way. Just 23.3% of Malaysia’s catch comes from overexploited or collapsed fish stocks, rated green — a sharp contrast with Japan’s 60.9% and New Zealand’s 60.4%, the two other Pacific-adjacent economies RYB has reviewed. On this specific measure, Malaysia’s waters are in meaningfully better shape than either.
Three VNRs on a disciplined four-year cycle
Malaysia has presented three Voluntary National Reviews — 2017, 2021, and 2025 — and has done so on a deliberate, stated four-year cycle, a level of consistency RYB hasn’t seen matched elsewhere. The 2025 VNR reported that an estimated 43% of Malaysia’s SDG targets are on track for 2030, more than double the estimated global average of 17%, framed by the government against the backdrop of its Eleventh and Twelfth Malaysia Plans, which have systematically built the SDGs into national five-year planning since 2016.
A national roadmap that helped write the region’s rulebook
Malaysia’s city-level reporting is unusually deep and unusually well-coordinated. Since 2021, at least eight Malaysian local authorities — including Kuala Lumpur, Shah Alam, Subang Jaya, Putrajaya, Alor Gajah, Malacca City, and Sepang — have published Voluntary Local Reviews under a national “Malaysia SDG Cities Roadmap,” coordinated by URBANICE Malaysia. In 2023, Selangor became the first Malaysian state to publish a Voluntary Sub-national Review, adding a reporting tier above the city level that few other countries RYB has covered have built. Malaysia’s role runs deeper than its own cities, too: Penang hosted the 7th Asia-Pacific Urban Forum in 2019, which produced the Penang Platform for Sustainable Urbanization — the partnership behind the Asia-Pacific Regional Guidelines on Voluntary Local Reviews that other cities across the region, including Japan’s, now draw on. Malaysia isn’t just localizing the SDGs; it helped write the regional playbook for how to do it.

What the SDR Shows: International Spillovers
The Sustainable Development Report scores every country two ways. The overall score measures how well a country is doing for its own people. The spillover score measures how much harm a country’s economy causes everyone else.
Malaysia’s spillover rank of 109th out of 169 is, unusually among the countries RYB has reviewed, an improvement on its overall rank of 76th — the opposite pattern from every wealthy country covered so far, where spillover rank falls well below overall rank. Three indicators explain why Malaysia’s footprint stays comparatively light.
Plastic waste exports: the lowest RYB has recorded
Malaysia exports just 0.524 kg of plastic waste per capita, rated green — the lowest figure RYB has recorded for any country, a striking contrast with Germany’s 8.98 kg, the highest.
Weapons exports: minimal
Malaysia’s weapons exports come to just 0.058 TIV per 100,000 population, rated yellow, comparable to New Zealand’s 0.471 and far below every European economy RYB has covered.
A tax haven figure that can’t be verified — and a real gap in the data
Malaysia’s Corporate Tax Haven Score in the underlying database is flagged as imputed rather than measured, so it isn’t cited here. Its Financial Secrecy Score is missing from the dataset entirely — not zero, not imputed, simply not reported — a genuine data gap rather than a clean bill of health.
Why These Numbers Matter
A high overall SDG score measures how a country treats its own people. It says nothing about what that country’s economy asks of everyone else — the waste it exports, the weapons it sells, the profits that pass untaxed through its financial system. Malaysia’s case runs the pattern in reverse from most wealthy countries RYB has covered: a country still working through domestic gaps in nutrition, inequality, and gender representation, whose international footprint is nonetheless comparatively light.
RYB’s Place in This Picture
Malaysia’s spillover rank of 109th is the best of any country RYB has reviewed so far — ahead of Japan’s 128th, New Zealand’s 145th, and Germany’s 149th. See the full picture, ranked side by side, on RYB’s Global Responsibility page.
UNDP
Human Development Report — Malaysia
The Human Development Index measures something narrower and older than the SDGs: life expectancy, education, and income, combined into a single score, with no 2030 deadline attached. It is a different lens on the same country, worth reading alongside the SDG data above rather than instead of it.
Malaysia’s HDI is 0.819 (2023 data), ranking 67th globally — just inside the “very high” development tier, whose threshold is 0.800. Life expectancy is 76.7 years and GNI per capita is $32,553. Adjusted for planetary pressures — carbon emissions and material footprint — Malaysia’s score falls more sharply than most countries RYB has seen, to a Planetary-pressures-adjusted HDI of 0.677, pushing its effective rank down five places to 72nd. That drop lines up closely with the deforestation and low renewable-energy figures already visible in the SDG data above. Domestically, Malaysia’s own statistics agency publishes a comparable Malaysia Human Development Index by state: Kuala Lumpur leads at 0.899, while Kelantan sits lowest at 0.763 — a real development gap within one country of just over 35 million people.