

United Kingdom Sustainable Development Goals (SDGs)
8
SDG Index rank, out of 169 countries
82.5
SDG Index score, out of 100
161
Spillover rank — among the worst globally
54.9
Spillover score, out of 100
Source: Sustainable Development Report 2026, SDSN / Dublin University Press
Most people have never heard of the Sustainable Development Goals in any real detail. Surveys across the US, UK, France, and Germany find only 8–12% of people can actually say what the SDGs are. In the UK specifically, as many as 68% have never heard of them at all, the least spontaneous awareness of the four countries surveyed. RYB exists to close that gap, looking at the same reports and reviews the UN and researchers use, and explaining them as we go.
In 2024, the UK ranked 14th in the world for gender equality. A year later, it ranked 4th. No country climbed faster. That story, and a very different one about how the UK reports, and doesn’t report, on its broader SDG progress, are both worth understanding here.
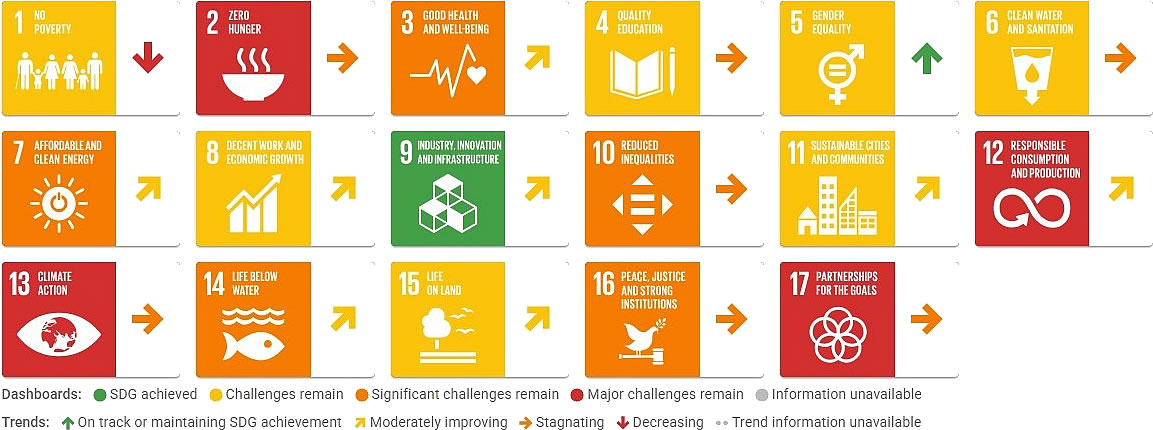
United Kingdom — Sustainable Development Report 2026
UK
Voluntary National Reviews: One Review, Seven Years Ago
The Voluntary National Review (VNR) is how a country tells the world how it’s doing on the SDGs. Countries present these at the UN’s High-Level Political Forum every July. It isn’t mandatory. It is, by now, nearly universal: since 2016, more than 440 VNRs have been submitted worldwide.
The UK submitted its only VNR in July 2019. Most countries have since moved on to their second, third, or even fourth review. The UK hasn’t returned to the table once in seven years.

A City Stepped In Where the Country Hasn’t
While national reporting stalled, one UK city quietly picked up the slack. Bristol became the first UK city, and one of the first cities in the world, to publish a Voluntary Local Review (VLR), the city-level version of a VNR. It grew out of a partnership between the University of Bristol’s Cabot Institute and the city’s One City Office, starting as a single postgraduate research project before becoming a citywide review covering all 17 goals, presented at the UN’s 2019 High-Level Political Forum.
London followed a similar path, through the work of the London Sustainable Development Commission. Other cities haven’t kept pace; researchers studying Greater Manchester and Sheffield found no further SDG-specific work had taken place since early local studies.
The Office for National Statistics (ONS) holds data for 78% of SDG indicators nationally, reported through the international Open SDG platform, also used by 18 other countries, cities, and regions. In 2020, the ONS began piloting a local version of this platform, using Bristol as the test case.
What the Sustainable Development Report Shows: Two Very Different Scores
The Sustainable Development Report scores every country two ways. The overall score measures how well a country is doing for its own people. The spillover score measures how much harm a country’s economy causes everyone else.
The UK’s overall score sits at 82.5 out of 100, ranking 8th out of 169 countries, just inside the global top ten. Its spillover score sits at just 54.9 out of 100, ranking 161st, near the very bottom of the same table.
Why the Spillover Score Is So Low
- Exports of plastic waste rate red. The UK exports 11.966 kg per capita on the most recent available data, far above Finland’s 4.525 and dramatically above Brazil’s 0.025.
- Conventional weapons exports rate orange. The UK’s figure, 1.553 TIV per 100,000 people, sits between Finland’s yellow and the Netherlands’ red.
- The Corporate Tax Haven Score sits at 86.25 out of 100, where 100 is worst, the highest, meaning worst, score of any country RYB has compared so far, ahead of even the Netherlands.
- The Financial Secrecy Score sits at 69.5, in the same range as the Netherlands and the US.
This is not new, and it isn’t subtle. Year after year, the UK rates among the worst G20 nations on its tax haven score. The mechanism is concrete: the City of London and the UK’s network of Overseas Territories and Crown Dependencies, including the Cayman Islands and the British Virgin Islands, host financial structures that let companies and individuals avoid tax obligations elsewhere. Every pound sheltered this way is a pound a country, often a far poorer one, cannot collect to fund health, education, or infrastructure.
RYB’s Brazil SDGs page shows the opposite is possible. Brazil ranks lower overall, 53rd, but scores 96.6 on spillovers, 6th in the world, green across nearly every indicator the UK scores red or orange on. The UK’s spillover problem isn’t an inevitable cost of being a wealthy, high-ranking country. It’s a specific policy choice, built over decades, that a country like Brazil simply hasn’t made.
UNDP
Human Development Index: A Third Lens
A third measure adds more texture to this picture: the Human Development Index (HDI), published annually by the UN Development Programme. Unlike the SDG Index, the HDI ignores GDP entirely. It measures only three things: how long people live, how educated they are, and how much income they earn.
By that measure, the UK performs solidly, sitting comfortably inside the “very high human development” tier alongside the rest of Western Europe. The more revealing number is the Inequality-adjusted HDI (IHDI), which discounts a country’s score based on how unevenly its gains are shared. As with several countries RYB has compared this year, the gap between a country’s raw HDI rank and its inequality-adjusted rank often says more than either number alone.
United Kingdom’s Human Development Index data →
What is the difference between the HDI and the SDGs? →
Why These Numbers Matter
These pages matter more than their topic suggests on the surface. The SDGs are, in effect, the world’s working roadmap for its biggest shared problems, yet most citizens have never engaged with them directly. A Voluntary Local Review can change that at the scale where it’s most achievable: one city, one community, people who might otherwise never cross paths brought into the same conversation about what their home needs most.
Bristol’s own VLR shows what that looks like when one city decides not to wait for national leadership.
RYB’s Place in This Picture
RYB tracks the UK’s gender gap, because political breakthroughs like 2025’s cabinet shift shape the broader Women, Culture and Peace story RYB follows across countries. The VNR silence and the spillover score are the harder, less celebratory parts of the same national story, and worth reading alongside the gender-equality win, not instead of it.
Looking Forward
Watch whether the UK’s political gains on gender equality spread to its weakest areas: a near-bottom spillover rank, and a national SDG review that hasn’t been updated since 2019. A gender-equal cabinet and a tax haven score among the worst in the G20 tell two very different stories about the same country, in the same year.
Sources
- UK’s Voluntary National Review of the SDGs, GOV.UK — gov.uk/uks-voluntary-national-review-of-the-sustainable-development-goals
- Voluntary National Reviews, UN High-Level Political Forum — hlpf.un.org/vnrs
- Voluntary Local Reviews: A Handbook for UK Cities, University of Bristol Cabot Institute — bristol.ac.uk/media-library/sites/cabot-institute-2018/documents/uk-cities-voluntary-local-review-handbook.pdf
- Bristol First UK City to Publish Voluntary Local Review, SDSN TReNDS — sdsntrends.org/blog/2019/7/17/bristol-first-uk-city-vlr
- Bristol UK Pilots Local Version of SDG Data Tool, SDG Knowledge Hub — sdg.iisd.org/news/bristol-uk-pilots-local-version-of-sdg-data-tool/
- Localizing the SDGs in England, Frontiers in Sustainable Cities — frontiersin.org/journals/sustainable-cities/articles/10.3389/frsc.2021.746337/full
- Sustainable Development Report, United Kingdom Profile, SDSN — dashboards.sdgindex.org/profiles/united-kingdom